
Understanding lawyer salaries is crucial for anyone considering a career in law or for those already in the field looking at relocation or career advancement. While the national average provides a baseline, the reality is that lawyer compensation varies significantly depending on location. This article breaks down lawyer salaries across the United States, highlighting the states where lawyers earn the most and least, and explores the trends shaping legal incomes.
According to the latest data from the Bureau of Labor Statistics, the average annual lawyer salary in the United States is approximately $135,740. Furthermore, the job market for lawyers is projected to grow at a healthy rate of 8 percent over the next decade, which is faster than the average for all occupations. This indicates a stable and potentially lucrative career path.
However, the national average only tells part of the story. The state in which a lawyer practices has a dramatic impact on their earning potential. For instance, California, renowned for its robust legal market, boasts an average lawyer salary of $201,530. This figure is over $110,000 higher than the average salary in Wyoming, which represents the lower end of the pay scale for lawyers. Interestingly, the District of Columbia tops even California, offering an average annual salary of $226,510 for lawyers, making it the highest paying region in the US.
The top-tier states for lawyer salaries include:
- District of Columbia: $226,510
- California: $201,530
- Massachusetts: $196,230
- New York: $188,900
- Delaware: $176,904
- Connecticut: $174,520
These states generally feature major metropolitan areas, high costs of living, and significant concentrations of large law firms and corporate headquarters, all factors that contribute to higher lawyer salaries.
Conversely, the states with the lowest average lawyer salaries are:
- Wyoming: $88,570
- Idaho: $96,810
- Montana: $98,170
- Kentucky: $99,840
- Mississippi: $101,240
These states often have smaller legal markets, lower costs of living, and different industry focuses, which can lead to lower average salaries for legal professionals.
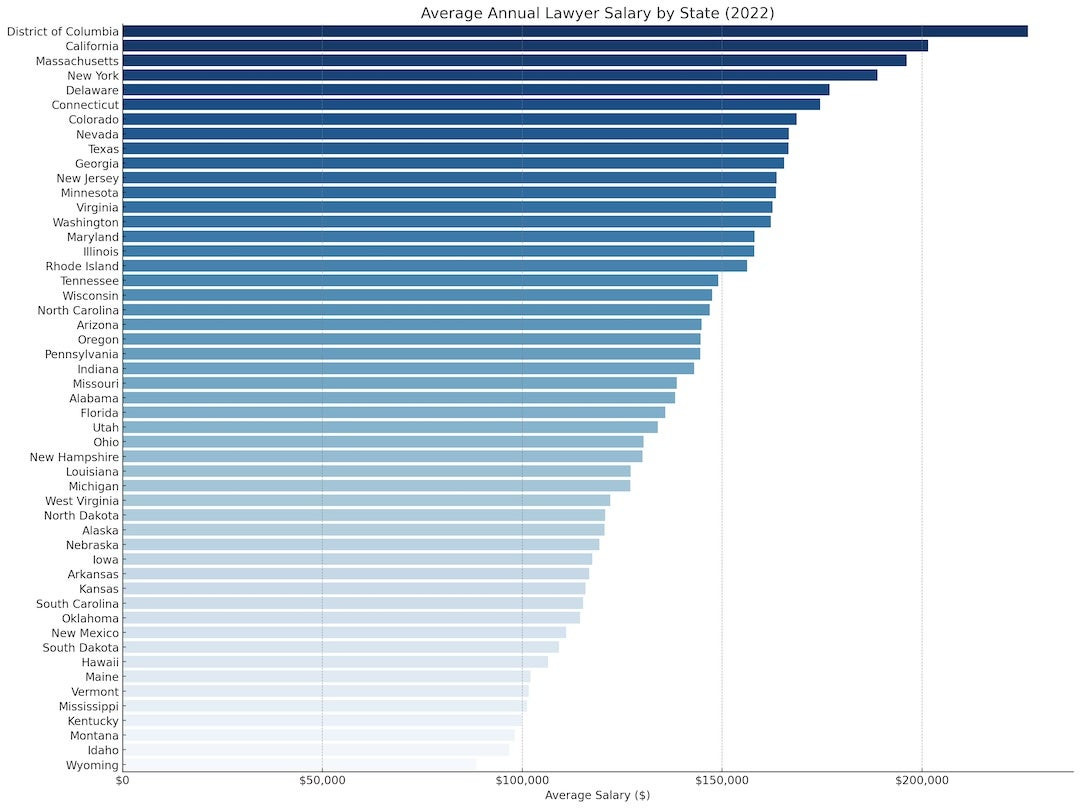 Map showing average annual lawyer salary by state in 2022, illustrating geographical disparities in legal profession income across the United States.
Examining salary trends over the past decade reveals which states have seen the most significant growth in lawyer compensation. Rhode Island leads the pack with a remarkable 57.86% increase in average lawyer salary over the last 10 years. Massachusetts follows with a substantial 46.03% growth, and Indiana, Wisconsin, and Tennessee also experienced robust increases of 44.17%, 40.40%, and 37.70% respectively. These figures indicate dynamic shifts in regional legal markets and evolving demand for legal services.
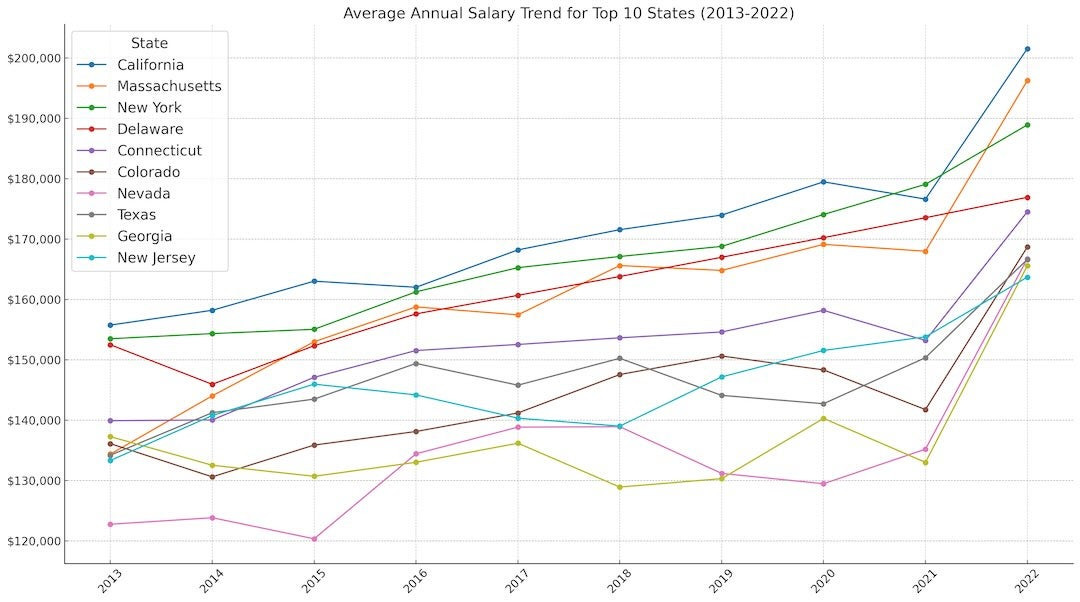 Line graph illustrating the average annual lawyer salary trend for the top 10 highest paying states from 2013 to 2022, showcasing the upward trajectory of lawyer earnings in leading legal markets.
Beyond location, numerous other factors influence how much a lawyer can make. Experience level is a primary determinant, with seasoned attorneys typically commanding higher salaries than entry-level associates. Specialization within law also plays a critical role; for example, lawyers specializing in highly sought-after fields like corporate law, intellectual property, or healthcare law often earn more than those in less specialized or lower-demand areas. The type and size of the employing organization also matter significantly. Lawyers working at large, prestigious law firms or in corporate legal departments generally receive higher compensation packages compared to those in smaller firms, non-profit organizations, or government positions.
In conclusion, while the average lawyer salary provides a general benchmark, the actual earning potential of a lawyer is heavily influenced by geographic location, experience, specialization, and employer type. States like California, Massachusetts, and New York continue to be the most lucrative for lawyers, while other states offer different compensation landscapes. For a more comprehensive understanding of lawyer salaries and detailed data across various roles and locations, explore Legal.io’s Salary Insights.
| Rank | State | 2022 Avg. Salary | 2021 Avg. Salary | 2020 Avg. Salary | 2019 Avg. Salary | 2018 Avg. Salary | 2017 Avg. Salary | 2016 Avg. Salary | 2015 Avg. Salary | 2014 Avg. Salary | 2013 Avg. Salary | 5-Year Change | 10-Year Change |
|---|---|---|---|---|---|---|---|---|---|---|---|---|---|
| 1 | California | $201,530 | $176,610 | $179,470 | $173,970 | $171,550 | $168,200 | $162,010 | $163,020 | $158,200 | $155,750 | 19.82% | 29.39% |
| 2 | Massachusetts | $196,230 | $167,980 | $169,120 | $164,800 | $165,610 | $157,450 | $158,760 | $152,990 | $144,030 | $134,380 | 24.63% | 46.03% |
| 3 | New York | $188,900 | $179,060 | $174,060 | $168,780 | $167,110 | $165,260 | $161,260 | $155,050 | $154,340 | $153,490 | 14.30% | 23.07% |
| 4 | Delaware | $176,904 | $173,531 | $170,223 | $166,978 | $163,795 | $160,673 | $157,610 | $152,330 | $145,940 | $152,490 | 0.00% | 0.00% |
| 5 | Connecticut | $174,520 | $153,200 | $158,190 | $154,610 | $153,640 | $152,540 | $151,540 | $147,100 | $140,040 | $139,920 | 14.41% | 24.73% |
| 6 | Colorado | $168,680 | $141,760 | $148,330 | $150,630 | $147,560 | $141,200 | $138,130 | $135,880 | $130,620 | $136,120 | 19.46% | 23.92% |
| 7 | Nevada | $166,740 | $135,200 | $129,480 | $131,190 | $138,920 | $138,850 | $134,440 | $120,360 | $123,850 | $122,770 | 20.09% | 35.81% |
| 8 | Texas | $166,620 | $150,350 | $142,730 | $144,110 | $150,250 | $145,800 | $149,400 | $143,490 | $141,240 | $134,200 | 14.28% | 24.16% |
| 9 | Georgia | $165,560 | $133,020 | $140,300 | $130,320 | $128,930 | $136,190 | $133,030 | $130,710 | $132,540 | $137,280 | 21.57% | 20.60% |
| 10 | New Jersey | $163,690 | $153,800 | $151,550 | $147,170 | $139,020 | $140,340 | $144,190 | $145,970 | $140,770 | $133,330 | 16.64% | 22.77% |
| 11 | Minnesota | $163,480 | $133,750 | $131,460 | $124,510 | $119,330 | $124,230 | $133,390 | $128,320 | $128,290 | $126,520 | 31.59% | 29.21% |
| 12 | Virginia | $162,640 | $146,140 | $151,970 | $143,220 | $139,180 | $136,790 | $139,050 | $135,180 | $131,320 | $129,800 | 18.90% | 25.30% |
| 13 | Washington | $162,200 | $136,210 | $131,530 | $129,550 | $136,480 | $129,220 | $126,900 | $124,000 | $120,740 | $119,900 | 25.52% | 35.28% |
| 14 | Maryland | $158,150 | $140,450 | $139,610 | $135,500 | $128,340 | $126,480 | $123,220 | $121,530 | $126,060 | $127,040 | 25.04% | 24.49% |
| 15 | Illinois | $158,030 | $148,280 | $153,720 | $157,010 | $152,980 | $140,920 | $129,070 | $125,920 | $124,680 | $132,910 | 12.14% | 18.90% |
| 16 | Rhode Island | $156,300 | $148,770 | $134,370 | $124,600 | $125,330 | $129,410 | $131,430 | $129,100 | $119,010 | $99,010 | 20.78% | 57.86% |
| 17 | Tennessee | $149,050 | $123,180 | $121,790 | $124,370 | $124,470 | $129,830 | $127,700 | $125,530 | $113,580 | $108,240 | 14.80% | 37.70% |
| 18 | Wisconsin | $147,530 | $131,630 | $124,410 | $129,440 | $130,450 | $123,600 | $111,080 | $101,990 | $101,980 | $105,080 | 19.36% | 40.40% |
| 19 | North Carolina | $146,890 | $131,960 | $132,190 | $133,290 | $129,990 | $137,200 | $138,470 | $123,940 | $118,310 | $114,840 | 7.06% | 27.91% |
| 20 | Arizona | $144,890 | $126,600 | $140,520 | $136,170 | $145,750 | $138,680 | $130,630 | $125,660 | $117,380 | $131,200 | 4.48% | 10.43% |
| 21 | Oregon | $144,610 | $139,520 | $128,160 | $116,860 | $119,500 | $117,810 | $114,730 | $117,800 | $114,870 | $111,640 | 22.75% | 29.53% |
| 22 | Pennsylvania | $144,570 | $133,330 | $139,120 | $142,890 | $138,610 | $139,050 | $134,600 | $131,090 | $129,460 | $134,250 | 3.97% | 7.69% |
| 23 | Indiana | $143,060 | $123,370 | $117,820 | $111,790 | $113,360 | $113,850 | $114,270 | $110,240 | $103,010 | $99,230 | 25.66% | 44.17% |
| 24 | Missouri | $138,680 | $126,940 | $111,020 | $109,820 | $113,780 | $115,520 | $116,060 | $114,480 | $121,500 | $116,190 | 20.05% | 19.36% |
| 25 | Alabama | $138,250 | $127,910 | $121,130 | $114,240 | $117,100 | $117,640 | $118,420 | $114,820 | $113,010 | $106,790 | 17.52% | 29.46% |
| 26 | Florida | $135,840 | $129,390 | $139,160 | $130,010 | $128,920 | $127,730 | $131,990 | $128,050 | $122,020 | $123,040 | 6.35% | 10.40% |
| 27 | Utah | $133,920 | $129,090 | $141,460 | $134,770 | $112,380 | $109,280 | $108,670 | $113,550 | $118,910 | $115,930 | 22.55% | 15.52% |
| 28 | Ohio | $130,320 | $122,550 | $128,170 | $124,160 | $121,520 | $113,610 | $113,400 | $113,360 | $113,200 | $108,950 | 14.71% | 19.61% |
| 29 | New Hampshire | $130,130 | $124,230 | $129,590 | $126,220 | $125,890 | $119,650 | $115,410 | $114,470 | $111,050 | $112,710 | 8.76% | 15.46% |
| 30 | Louisiana | $127,150 | $110,340 | $112,190 | $108,070 | $105,490 | $101,170 | $105,740 | $111,240 | $113,830 | $110,760 | 25.68% | 14.80% |
| 31 | Michigan | $127,030 | $121,780 | $119,150 | $116,310 | $110,180 | $112,740 | $110,760 | $110,920 | $116,710 | $114,460 | 12.68% | 10.98% |
| 32 | West Virginia | $122,070 | $107,380 | $109,290 | $102,040 | $98,630 | $95,220 | $100,430 | $98,270 | $94,010 | $90,240 | 28.20% | 35.27% |
| 33 | North Dakota | $120,780 | $107,190 | $113,480 | $113,280 | $107,290 | $97,680 | $102,660 | $101,840 | * | $90,850 | 23.65% | 32.94% |
| 34 | Alaska | $120,590 | $113,910 | $116,440 | $115,260 | $121,680 | $122,870 | $123,770 | $121,910 | $117,910 | $120,500 | -1.86% | 0.07% |
| 35 | Nebraska | $119,310 | $106,560 | $118,070 | $112,860 | $108,170 | $110,950 | $107,590 | $106,460 | $93,820 | $95,220 | 7.53% | 25.30% |
| 36 | Iowa | $117,500 | $117,580 | $122,400 | $119,700 | $112,630 | $113,470 | $108,660 | $106,820 | $106,080 | $106,920 | 3.55% | 9.90% |
| 37 | Arkansas | $116,730 | $107,750 | $94,800 | $94,000 | $98,780 | $99,100 | $103,980 | $100,320 | $100,690 | $101,340 | 17.79% | 15.19% |
| 38 | Kansas | $115,860 | $102,640 | $117,910 | $110,290 | $109,020 | $104,730 | $106,470 | $105,790 | $98,850 | $98,750 | 10.63% | 17.33% |
| 39 | South Carolina | $115,230 | $107,780 | $114,320 | $111,090 | $105,320 | $104,300 | $107,230 | $109,250 | $113,760 | $108,790 | 10.48% | 5.92% |
| 40 | Oklahoma | $114,470 | $105,370 | $122,040 | $116,270 | $118,790 | $115,260 | $123,510 | $116,900 | $112,520 | $101,310 | -0.69% | 12.99% |
| 41 | New Mexico | $110,970 | $116,220 | $107,700 | $103,290 | $105,910 | $99,510 | $97,100 | $91,430 | $96,520 | $98,150 | 11.52% | 13.06% |
| 42 | South Dakota | $109,190 | $100,100 | $111,930 | $112,810 | $109,070 | $100,000 | $101,360 | $96,580 | $98,360 | $99,650 | 9.19% | 9.57% |
| 43 | Hawaii | $106,520 | $102,090 | $114,520 | $109,420 | $111,290 | $113,190 | $106,650 | $104,180 | $105,410 | $108,820 | -5.89% | -2.11% |
| 44 | Maine | $102,060 | $100,890 | $98,980 | $106,350 | $107,120 | $102,040 | $106,270 | $99,260 | $100,720 | $93,940 | 0.02% | 8.64% |
| 45 | Vermont | $101,610 | $94,810 | $100,950 | $104,790 | $107,490 | $105,900 | $103,970 | $106,610 | $101,620 | $98,580 | -4.05% | 3.07% |
| 46 | Mississippi | $101,240 | $97,440 | $93,380 | $95,040 | $97,990 | $106,360 | $114,710 | $103,180 | $99,470 | $92,640 | -4.81% | 9.28% |
| 47 | Kentucky | $99,840 | $96,940 | $105,130 | $102,980 | $100,100 | $95,890 | $93,020 | $93,560 | $92,090 | $90,200 | 4.12% | 10.69% |
| 48 | Montana | $98,170 | $96,200 | $93,220 | $83,030 | $88,600 | $83,150 | $83,330 | $82,070 | $75,720 | $75,360 | 18.06% | 30.27% |
| 49 | Idaho | $96,810 | $99,740 | $108,470 | $105,450 | $99,360 | $98,390 | $91,390 | $96,900 | $100,900 | $105,380 | -1.61% | -8.13% |
| 50 | Wyoming | $88,570 | $92,410 | $102,810 | $100,090 | $105,600 | $98,090 | $112,710 | $102,130 | $103,290 | $89,280 | -9.71% | -0.80% |
Source: Occupational Outlook Handbook published by the Bureau of Labor Statistics.